
Monitoring platform
 Unified monitoring and alerting for critical infrastructure.
Track-TP brings network devices, power systems, radio links, sensors, and remote sites together in a single real-time monitoring platform, with notifications via Email, Telegram, and WhatsApp.
Track-TP is the network and device monitoring platform developed in-house by Teleproject for telecom operators, infrastructure managers, and field-service organizations. Radio equipment, power systems, microwave links, and IoT sensors: every part of the network flows into a single real-time platform.
Once devices are registered, Track-TP continuously checks their network presence and telemetry, receives SNMP (Simple Network Management Protocol) traps and syslog messages, evaluates your alarm rules, and sends notifications in several ways — all shown on an interactive map and on the dashboards you build yourself. The platform is available in the managed cloud or on-premises on a dedicated Linux server at the customer site.





























Don’t see your manufacturer? On request we integrate any device that uses SNMP, MQTT, Modbus TCP, OPC UA, BACnet/IP, IEC 60870-5-104, DNP3, syslog, or HTTP. Request an integration
Why choose Track-TP.
Six fixed points that set Track-TP apart from generic monitoring tools: multi-manufacturer coverage, real time, multi-channel alarms, and an open architecture.
One platform, every manufacturer
No more juggling a different tool for each manufacturer: Track-TP uses SNMP, MQTT, Modbus TCP, OPC UA, BACnet/IP, IEC 60870-5-104, DNP3, syslog, and HTTP, and ships with over 50 preconfigured device models, with new manufacturers added on request.
Everything in real time
A WebSocket connection brings status changes, incoming traps, new telemetry, and syslog messages to the screen the moment they happen, without reloading the page.
Alarms people actually see
Critical events go out via Email, Telegram, WhatsApp, SNMP trap forwarding to your NMS, and in-app notifications. Everyone chooses how to be reached.
The map as the main view
You can place every device and sensor on the map, draw geofences and routes, group by site, and move from the overview down to the individual cabinet.
Open and interoperable
Standard protocols, a REST API, inbound data via webhook, and an SNMP agent that lets an external NMS query Track-TP directly.
Multilingual interface
The interface is available in 6 languages: every team uses it in its own.
One flow, from source to notification.
Devices and sensors send data via SNMP, syslog, REST, MQTT, and ChirpStack webhooks to the platform, which feeds dashboards, the map, and alarms, and delivers notifications the way each user prefers. A built-in SNMP agent lets an external NMS read device status.
- Sources
- Network devices and servers, mission-critical radios and repeaters, UPS and DC power, microwave links, LoRaWAN sensors.
- Inbound protocols
- SNMP v1/v2c/v3 with traps, syslog (RFC 5424/3164), REST/HTTP, MQTT, Modbus TCP, OPC UA, BACnet/IP, IEC 60870-5-104, DNP3, and ChirpStack webhooks all converge on the platform.
- Track-TP
- Checks reachability and telemetry, then evaluates them against the alarm rules. In the managed cloud or on-premises on a Linux server.
- Visualization
- Configurable dashboards, a real-time map, and alarms raised on threshold rules.
- Notification channels
- Email, Telegram, WhatsApp, SNMP trap forwarding to an external NMS, and in-app notifications.
- SNMP agent
- Track-TP exposes an SNMP agent: an external NMS reads device status and alarms, read-only.
Track-TP uses the protocols you already run on your network.
Open standards, inbound and outbound: Track-TP polls your devices as a monitoring manager and feeds your upstream NMS as a data source.
- Polling
- Queries device telemetry via GET, GETNEXT, and GETBULK.
- Inbound traps
- Receives v1 and v2c traps on UDP port 162, matched automatically to the alarm rules.
- Trap forwarding
- Every alarm can be re-sent as a v2c trap to one or more upstream NMS.
- Built-in agent
- An external NMS reads device status and alarms, read-only.
syslog
RFC 5424 and RFC 3164 server over UDP, with severity filtering and configurable retention.
ICMP
Device reachability checks at a configurable interval.
REST and HTTP API
The same API the platform runs on, with per-device and per-service keys. Teleproject devices register and send telemetry via HTTP.
MQTT
Receives IoT device telemetry via publish/subscribe on an MQTT broker.
Modbus TCP
Reads registers from PLCs, energy meters, and industrial equipment via Modbus TCP.
OPC UA
Connects to SCADA systems and industrial automation platforms through OPC UA.
BACnet/IP
Integrates building systems: HVAC, access control, and panels in the technical rooms.
IEC 60870-5-104
Acquires measurements, states, and events from RTUs and electrical substations via IEC 60870-5-104 over TCP/IP.
DNP3
Monitors RTUs and SCADA devices for power, water, and utilities, with polled reads and report-by-exception over TCP/IP.
ChirpStack webhook
Receives all LoRaWAN sensor events, secured by an API key: uplink, join, status, and location.
New device types and new manufacturer MIBs are added on request: if a device uses SNMP, MQTT, Modbus TCP, OPC UA, BACnet/IP, IEC 60870-5-104, DNP3, syslog, or HTTP, it can be integrated into Track-TP.
Online or in alarm, you see it at a glance.
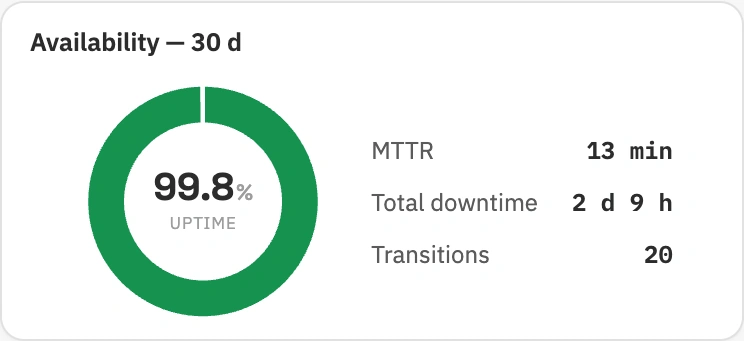
Track-TP logs every online-to-offline transition with a timestamp and flags sites in alarm at once. Status changes on the dashboard and the map in real time, over a WebSocket connection, so the control room can act without waiting for the next refresh.
- State transitionsonline and offline logged with a timestamp
- Push updatesdashboard and map updated via WebSocket, no reload
- Per-channel monitoringon multi-channel devices, down to the single channel
- Status historya log of status changes for every site
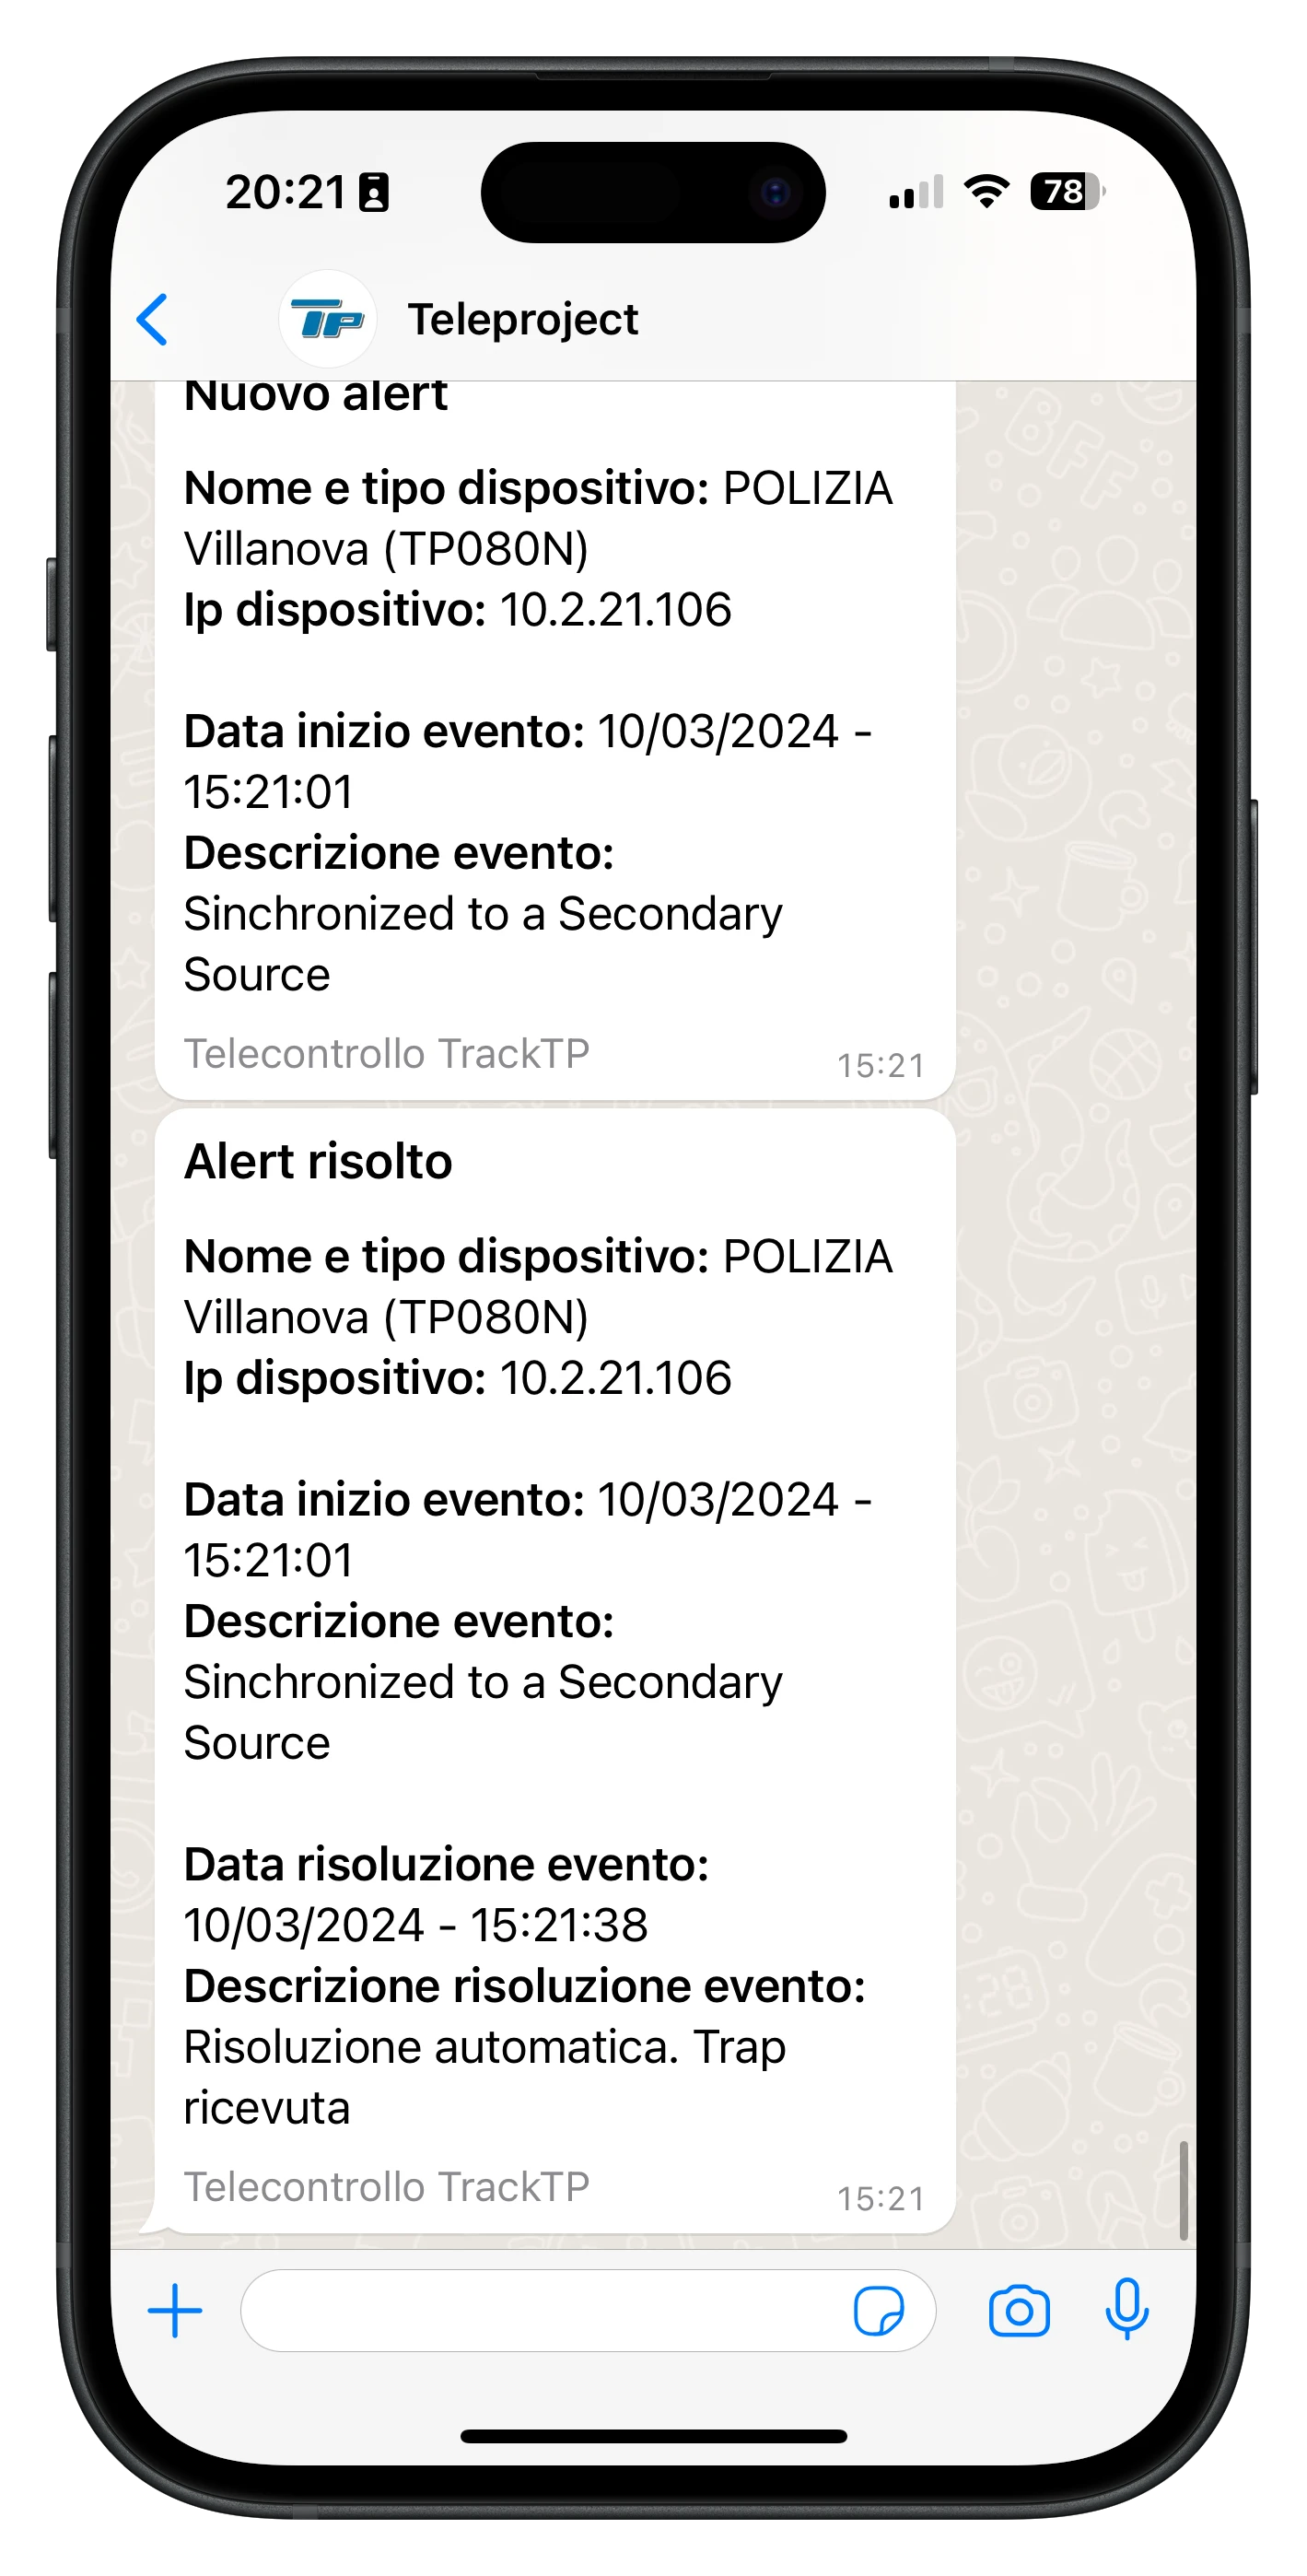
From SNMP trap to WhatsApp message in seconds.
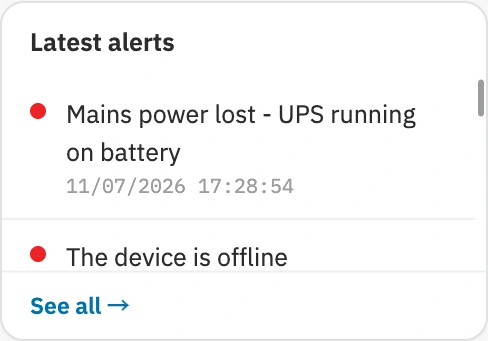
Monitoring only matters if the alarm reaches the right person in time. Track-TP turns telemetry, traps, and status changes into alarms and delivers them where you already work. You can set threshold rules, three priorities, a notification delay, and maintenance mode for planned work.
- Emailwith alarm and device detail
- Telegramformatted messages to subscribed chats via a bot
- WhatsAppvia the official Meta Cloud API
- SNMP trapalarm forwarding to your NMS
- In-appreal-time notifications
- Time windowseach user receives notifications only during the hours they set
The interface, screen by screen.
All supervision runs from a single web application: the overview dashboard, real-time map, alarm queue, LoRaWAN sensors, and device management.
The first screen of the shift: network availability, mean time to repair (MTTR), online and offline devices, active alarms, and the trend of the last 24 hours.
Geolocated devices and sensors with icons by type, marker clustering, geofences, and routes. From the national view down to the individual cabinet.
An alarm queue with informational, warning, and critical priorities. Every event records who resolved it, when, and why, with a full history.
LoRaWAN sensors integrated via ChirpStack: battery level, signal quality, last reception, and readings compared against the configured thresholds, on the same platform.
Devices monitored and grouped by site, region, or function. Over 50 preconfigured device models, plus a generic SNMP/MQTT/ping profile.
Panels dedicated to sensors: historical charts, tables by type, and a map, to keep the environment and infrastructure under control on a single screen.


Explore the Track-TP section.
Eight in-depth pages, from features to integrations to frequently asked questions.
- 01
Features
SNMP monitoring, alarms, dashboards, and maps in detail.
- 02
Integrations
SNMP, syslog, REST API, and ChirpStack webhooks.
- 03
Supported devices
Over 50 device models from various manufacturers, plus LoRaWAN sensors.
- 04
Alarms and notifications
Threshold rules and notifications via Email, Telegram, WhatsApp, SNMP trap, and app.
- 05
Dashboards and maps
Dashboards with 13 widgets and a real-time interactive map.
- 06
Data and security
History, export, data retention, roles, and an audit log.
- 07
Use cases
Telecom, power, security, and IoT across distributed infrastructure.
- 08
Frequently asked questions
SNMP versions, devices, alarm notifications, LoRaWAN, and integrations.
Your whole network under control.
In a single platform.
Together we map the devices and sensors to supervise, size any LoRaWAN network, and choose between cloud and on-premises. Design, installation, and technical support handled directly by Teleproject.